

VLOOKUPS: A Guide to Consolidating Data Across Spreadsheets

You’ve meticulously collected insights on your customer advocates and their participation in reference activities and are ready to deliver a compelling report on your impact on customer engagement this quarter except for one, small catch; your data on program members’ basic information and the report on their historical participation is shown in completely separate spreadsheets!
Sound familiar?
We have all been in a situation where we have two reports and need them combined, i.e. so information from one is pulled into the other. Luckily, the VLOOKUP function in Excel does just that.
VLOOKUP can seem intimidating as it is a more complex Excel function, but this tutorial will walk you through the steps and explain common pitfalls when using the VLOOKUP function.
Getting Started
For the VLOOKUP function to work correctly, your spreadsheets (aka data sets) must share a common, unique field. This can be a unique identifier such as a customer ID number, or sometimes you will need to create a unique ID, such as company name + advocate name. This unique ID must be in a column to the left of the information you would like to pull over, on both sheets.
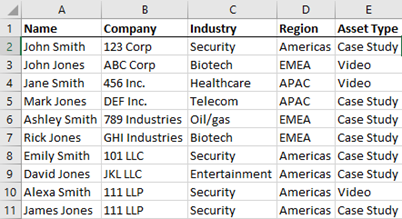
In this example, there are two data sets: Dataset 1 contains the information about the type of assets customer advocates are willing to be a reference for. Dataset 2 contains the advocates’ contact information. This example will use a VLOOKUP to add the advocates’ addresses from Dataset 2 to Dataset 1.
Dataset 1 – Asset type:
Dataset 2 – Advocate contact information:
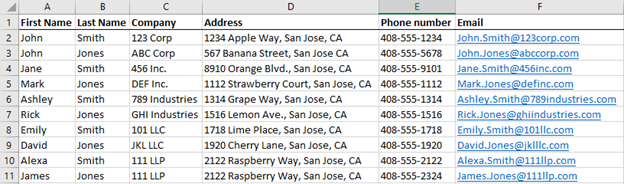
For this example, there is not currently a unique field between the two sets so we will need to create one. Looking at Dataset 1 and Dataset 2, the advocate’s name is the only common, unique field. However, Dataset 2 has the name split in two separate columns (First and Last names). In this case, you need to join the two columns together to create a unique ID between data sets (it is common that you will need to combine columns together to create a unique ID). This is achieved by using the CONCATENATE function, which joins together several columns into one.
Dataset 2:

To combine first and last name to create a unique ID using the CONCATENATE function:
Begin by inserting a column into which the concatenated name will be added.
Then type in the “concatenate” function as shown above, and select the column you want to appear first, in this case, it’s the first name.
Next, add a “space” as Dataset 1 has a space in between the first and last name, this is achieved by inserting “ “ into the CONCATENATE function.
Then, select the column with the last name in and close the formula parenthesis. Once this formula is copied down the entire table you are ready to run the VLOOKUP function in Dataset 1.
VLOOKUP Specifics
This example pulls the address from Dataset 2 into Dataset 1. As such, add a column for address at the end of Dataset 1 and type the equals sign and VLOOKUP into the top row of data. The easiest way to make sure the formula is correct is to use the function argument (Fx) button in the upper left corner. This will provide you instructions at the bottom of the pop-out box for each piece of the formula. Additionally, you will be able to see the value that is returned based on your inputs.

There are four items that need to be entered into the VLOOKUP function:
1. The first item in the function is the Lookup value, which is the unique ID between the two datasets. In this example, it is the full name, so we enter A2.
2. The second item is the table array, which is the table on the second sheet that you want to pull information from. The “table array” does not have to be all the information on the second sheet, it can be a subset of that information. The table array must start with the column with the unique ID in and go at least to the column with the information you want to pull. In this example, the full name in Dataset 2 is in column C so this is where our table array will start. Then select the columns to the right of column C that contain the information (in this example, column E).
Tip: If you are copying the VLOOKUP formula down a column it is helpful to “lock” the table reference, which will allow you to copy the formula down while keeping the table reference the same. To lock the table reference, click into the reference and hit F4 so that both the column and row references have $ signs in front of them. Do the same with the ending reference.
3. The third item in the formula is the column index number. This is the number of columns to the right of the unique ID that the information is in. This is not the total number of columns on the page, nor the column number from the beginning of the page. To get this number start at 1 with your unique ID and then count to the right until you reach the information you want to pull. In this example, the address is in column 3.

4. The last item in the formula is the Range lookup. For pretty much every VLOOKUP you will use “False”, which returns exact matches only. Once you are done entering the information then hit ok. The formula can then be copied down your dataset for all rows.
New Dataset 1, which now includes the addresses from Dataset 2:

Unlocking Insights in your Customer Advocacy Program Data
Knowing how to use a VLOOKUP formula is invaluable, as oftentimes you will have two reports from a reference management system (RMS) that need to be combined. Whether you use a spreadsheet with multiple worksheets or a formal RMS like ReferenceEdge or RO Innovation, there likely is plenty of opportunity to synthesize your program data for more detailed analysis.
Using this guide and the helpful hints inside, you will soon become a VLOOKUP pro, capable of delivering reporting on your customer advocacy program from a variety of perspectives. As always, if you need any assistance with data manipulation, please contact Referential; our Excel experts can help with any type of report!