
Leveraging Tracked Content in RO to make Monthly Recruitment Metrics Easy, Part 1 of 3

Customer marketing and advocacy, like all other departments, needs to demonstrate its value to the larger organization. When Referential works with clients, I and my colleagues strive to ensure the quality of work we deliver is timely and, most importantly, impactful. What’s the quickest way to demonstrate this?
Follow the numbers!
By that I mean: regularly timed reports.
Customer Reference Management Systems (RMS) in use by our clients are varied – we see many using Base (Crowdvocate), Influitive AdvocateHub, Point-of-Reference Reference Edge, SlapFive, and Excel spreadsheets to name a few – but today, I’m going to share how I put together a recruitment report for my clients using RO Innovation (formerly ReferenceView).
First: It all starts with consistency in using the “Tracked Content” section to track recruitment outreach
Aside from keeping tabs on assets in development, this module can be configured to track the steps in recruitment – such as outreach to account owners and outreach to the customer contacts – and store the notes of these outreaches and their replies, book next steps, and plan accordingly.
Once the steps are configured, for each Tracked Asset Name I have a standardized format: I include the type of outreach, the fiscal quarter and year it’s taking place in, the name of the account, and lastly the intended contact we’ll be reaching out to. The latter is usually provided via a nomination. When set up correctly, it looks like this: Recruitment Q421: Acme Company: Recruit Name

The reasoning behind this naming structure is that it dramatically simplifies creating easy to digest monthly reports, and when follow-up tasks are being leveraged it’s a swift reminder/memory jog.
As time progresses in your program, you’ll begin to build up quarters. Q121 becomes Q221 becomes Q321 and so on. This will impact how your reporting appears! The end result is the creation of a simple table that you can provide to management that details, ideally, the progress of your program overall. It looks something like this:
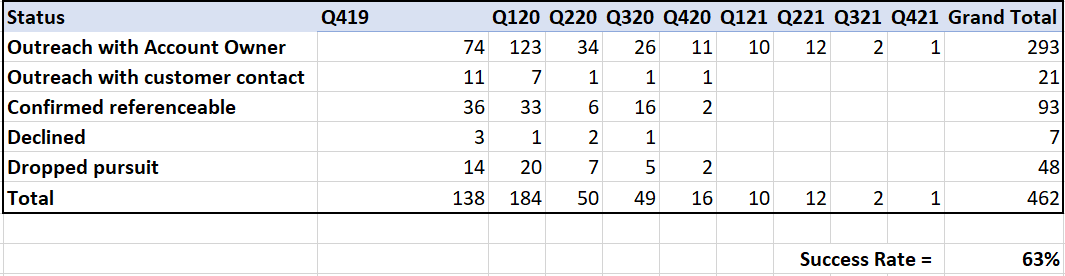
This enables you to establish a keen eye on the progress of your program and ultimately tabulate your program’s success rate.
Click here for part two of this series where I dive into putting this report together and explain how the results you’ll generate will help monitor the health of your program, while also addressing ways in which you can present this data to management!


Beta & Bubbles, Trusted’s beta launch event, was an event where leaders and practitioners gathered to explore how trust, advocacy, and customer relationships are influencing modern growth strategies. The event highlighted the growing importance of trust-led growth and how platforms like Trusted are helping organizations make trust measurable and actionable.